Key Features
- Supports nearly any type of SPI, including simplified SPI with no Chip Select and SPI DDR
- Interframe message time setup permits Frame definition for support of many proprietary USART-based protocols
- Flexible Bits/Word Decode Setup
- Does not require clock trace to be displayed during decode
- Use analog or digital (MSO) inputs for acquisition and triggering
- EXT input may be used for clock signal
- Intuitive, color-coded decode overlays
- Interactive protocol table with zoom and pattern search
- Automated timing measurements (TDME option only)
- Serial digital data extraction to an analog value (serial DAC) with waveform graphs (TDME option only)
- Eye Diagrams with failure location (TDME option only)
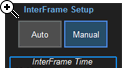
SPI Triggering When No Chip Select is Present ("T")
Most SPI triggers require that a Chip Select signal be present. However, simplified (single-master, single-slave) SPI (also referred to as SSPI or SIOP) has no Chip Select. Our solution still permits triggering on simplified SPI through use of an Interframe Setup time. In most cases, the AUTO default provides accurate results, but MANUAL selection is also available.
Interframe Message Time Setup for Proprietary USART-based Protocols ("T" and "D")
Two line (CLOCK and DATA) serial data signals with proprietary formats are sometimes used. This is commonly known as a USART. Given the flexibility of the setup of our trigger and decoder, it is often possible to use the Interframe Message Time Setup to "packetize" consecutive bytes into one Message Frame, and then trigger on serial data in a particular byte location in the complete multi-byte Frame. Then, SPI-CUSTOM may be used to decode information as a complete Frame instead of individual Bytes.
Conditional DATA Trigger Setup ("T")
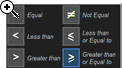
The trigger permits a conditional (<. <=, =, >, >=, <>, inside a range, outside a range) setup for the DATA condition. This is especially useful in situations where abnormal events should be monitored.
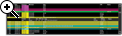
Intuitive, Color-coded Decode Overlays ("D")
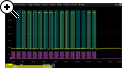
A transparent overlay with color-coding for specific portions of each protocol and the entire message frame makes it easy to understand your serial data information. Unlike other solutions, with protocol decode information away from the signal, our solution correlates the waveform and the protocol decode directly on the display. As the acquisition length is expanded or shortened, the decode overlay will adjust to show you just the right amount of information.
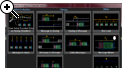
Interactive Table Summarizes Results ("D")
Turn the oscilloscope into a protocol analyzer with a tabular display of decoded information. Customize the table to show only the data of interest and touch a message in the table to automatically zoom to it and display it on the screen. Export the table for offline analysis. Up to four different decoded signals of any type may be simultaneously displayed in the table.
Measure/Graph Tools for Validation Efficiency ("M")
Quickly validate cause and effect with automated timing measurements to or from an analog signal or another serial message. Make multiple measurements in a single long acquisition to quickly acquire statistics during corner-case testing. Serial (digital) data can be extracted to an analog value and graphed to monitor system performance over time, as if it was probed directly. Complete validation faster and gain better insight.
Eye Diagrams ("E")
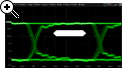
Rapidly display an eye diagram of your packetized low-speed serial data signal without additional setup time. Use eye parameters to quantify system performance and apply a standard or custom mask to identify anomalies. Mask failures can be indicated and can force the scope into Stop mode.