Power Analyzer allows all aspects of switched mode power devices to be measured in a single, highly integrated software tool as shown in Figure 1.
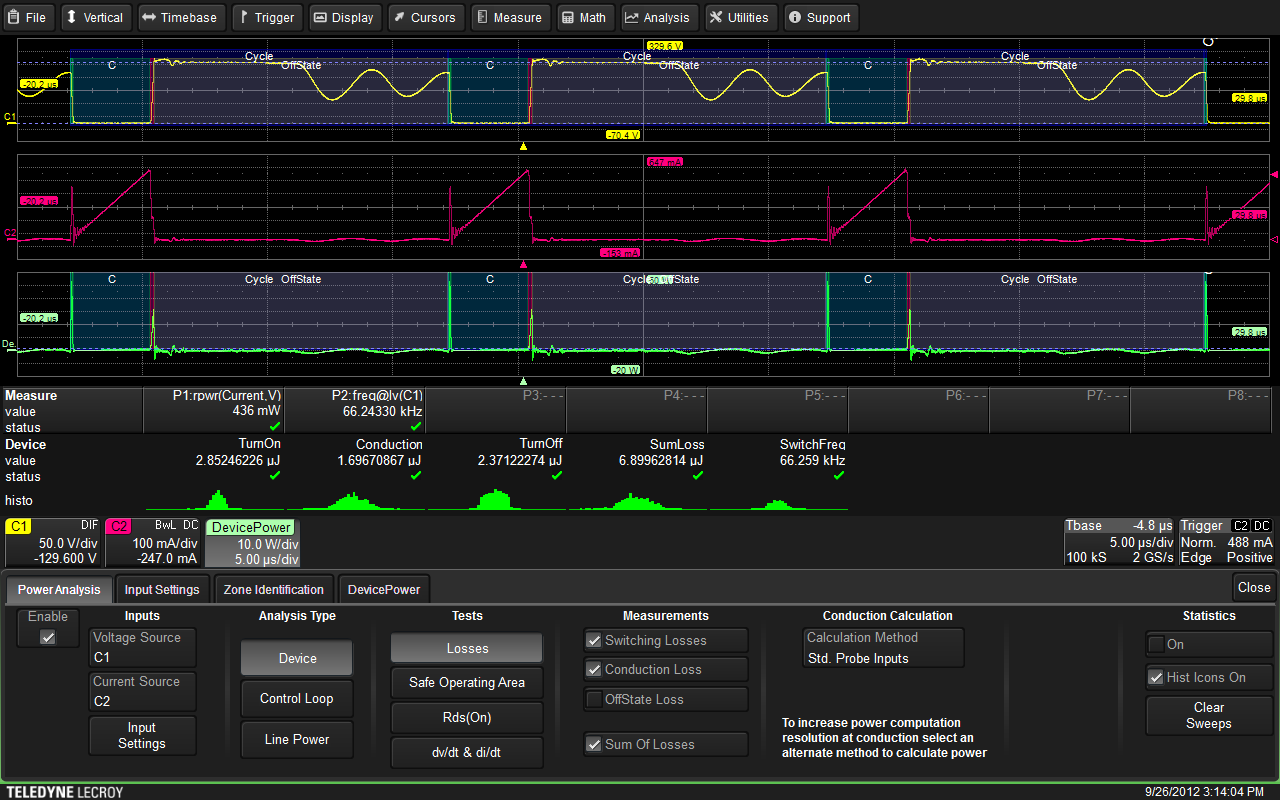
An example of the Power Analyzer option with a choice of Device, Control Loop, and Line Power Analysis
Device analysis such as power loss, saturation voltage, high side gate drive, dynamic-on resistance, safe operating area, and others are easily performed. Control Loop (Modulation) analysis provides tools for easy understanding of control loop response, such as soft start performance or step response to line and load changes.
Line Power Analysis allows simple and quick pre-compliance testing to EN 61000-3-2.
Power Analysis is a complete solution with a wide range of measurement and analysis tools. It features:
Device Analysis includes loss measurement, Safe Operating Area (SOA), Dynamic On Resistance (RD s [On]), and DV/dt and Di/dt.
Loss measurement, as shown in Figure 1, includes automatic identification of zones using color specific overlays to mark conducting and off state regions of device operation. Losses associated with the switching, conduction, and off state are measured independently and displayed along with the sum of selected loss types. Power analysis includes its own measurement display table allowing both conventional and power analysis measurements simultaneously.
Using an oscilloscope with a 12 bit dynamic range makes it easier to characterize saturation region measurements. The saturation region is typically a very low level, on the order of a Volt, that alternates with the off-state where the voltage may rise to several hundred Volts.
Safe Operating Area is another aspect of device characterization and an example is shown in Figure 2.
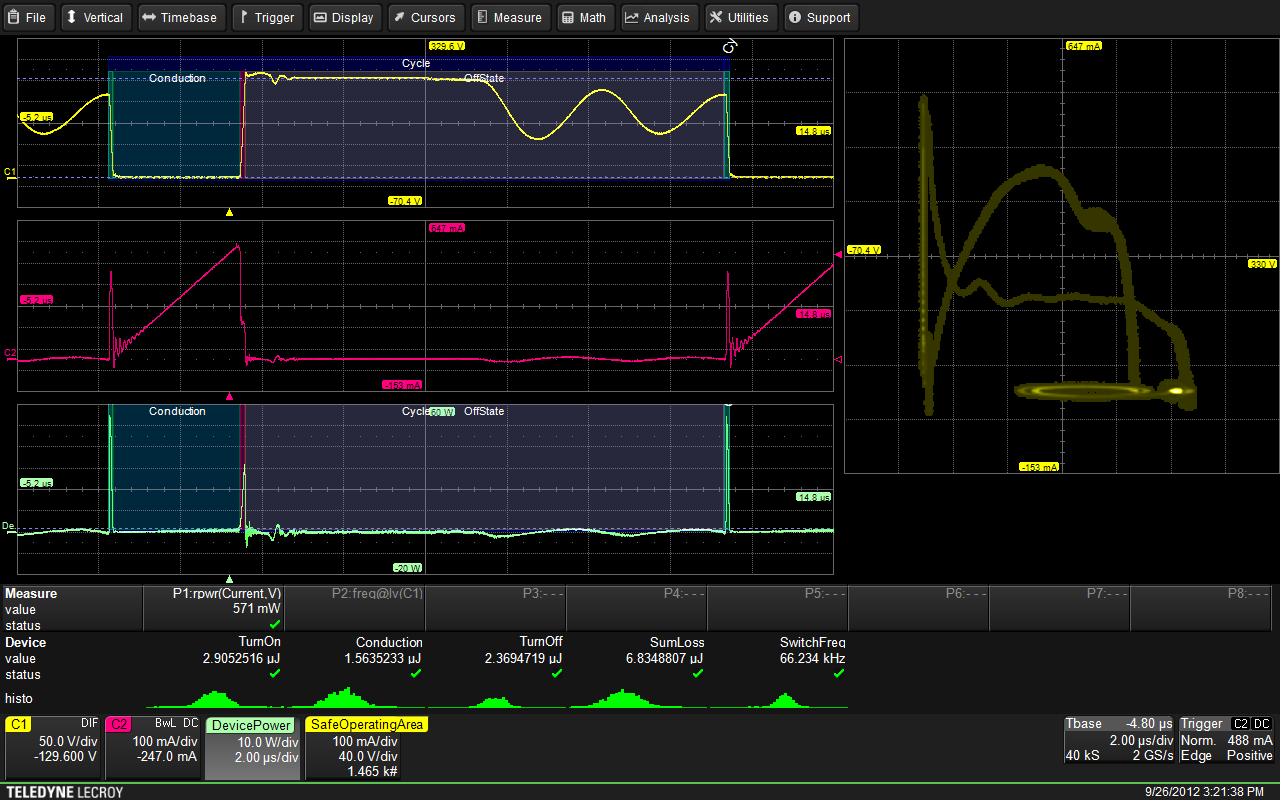
An example of a safe operating area plot
The safe operating area display plots device voltage as a function of current. It shows the in-circuit behavior of the device under test revealing any transitions near peak voltage, current, and power limits.
The loop dynamics of a switched mode power device can be evaluated using the Control Loop analysis of the Power Analysis software as shown in Figure 3
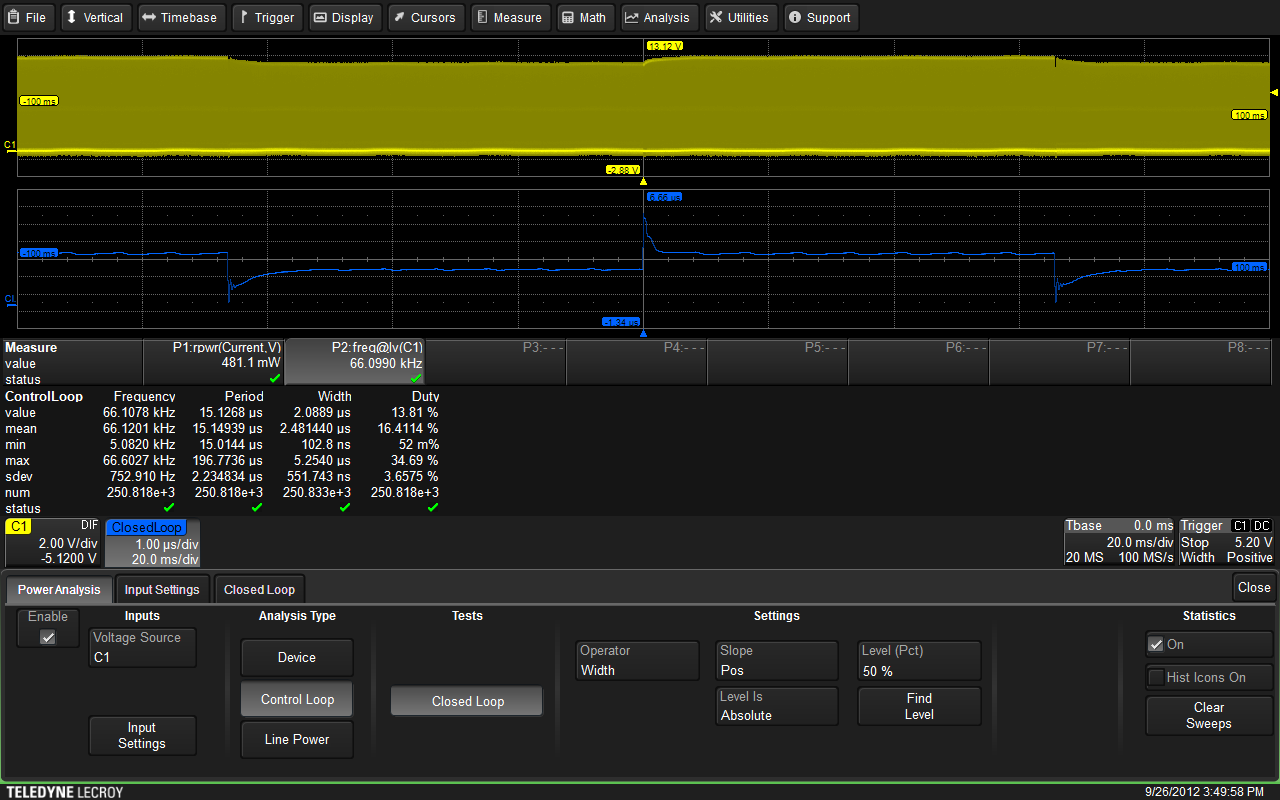
Closed loop analysis of the gate drive waveform for a switched mode power supply shows the variation in gate drive pulse width in response to a change in power supply loading
Control loop analysis studies the variation in the parameters of the switched mode power feedback loop. It plots the variation of pulse width, duty cycle, period or frequency. In Figure 3 the device under test is a power supply using pulse width modulation as the control method. The closed loop (CL) plot shows the variation of PWM controller width due to a 7.5 Hz square wave load change. The plot shows the dynamics of the width variation on a cycle by cycle basis. The Width parameter shows a variation of from 100 ns (min) to 5 µs (max). The duty cycle also shows a similar variation.
An import aspect of this type of analysis is the length of the oscilloscope memory. Most power supply variations take a long time. For example, startup may take several seconds. The HDO family of oscilloscopes support up to 250 Mpts of acquisition memory. In Figure 3 the capture time is 200 ms of time the oscilloscope is still acquiring at a 100 MS/s sampling rate. The final analysis mode of the Power Analyzer is Line Power. Here, line harmonics can be investigated to see if they are in compliance with international standards like EN 61000-3-2.
Line harmonic analysis is shown in Figure 4. Here, the in addition to the line voltage and current in channels C1 and C2 respectively, the first forty harmonics of the 60 Hz line current are displayed. The blue overlay shows the compliance levels for EN 61000-3-2. The table in the lower right of the display lists each of these harmonics and includes level, frequency, and conformance to the standard.
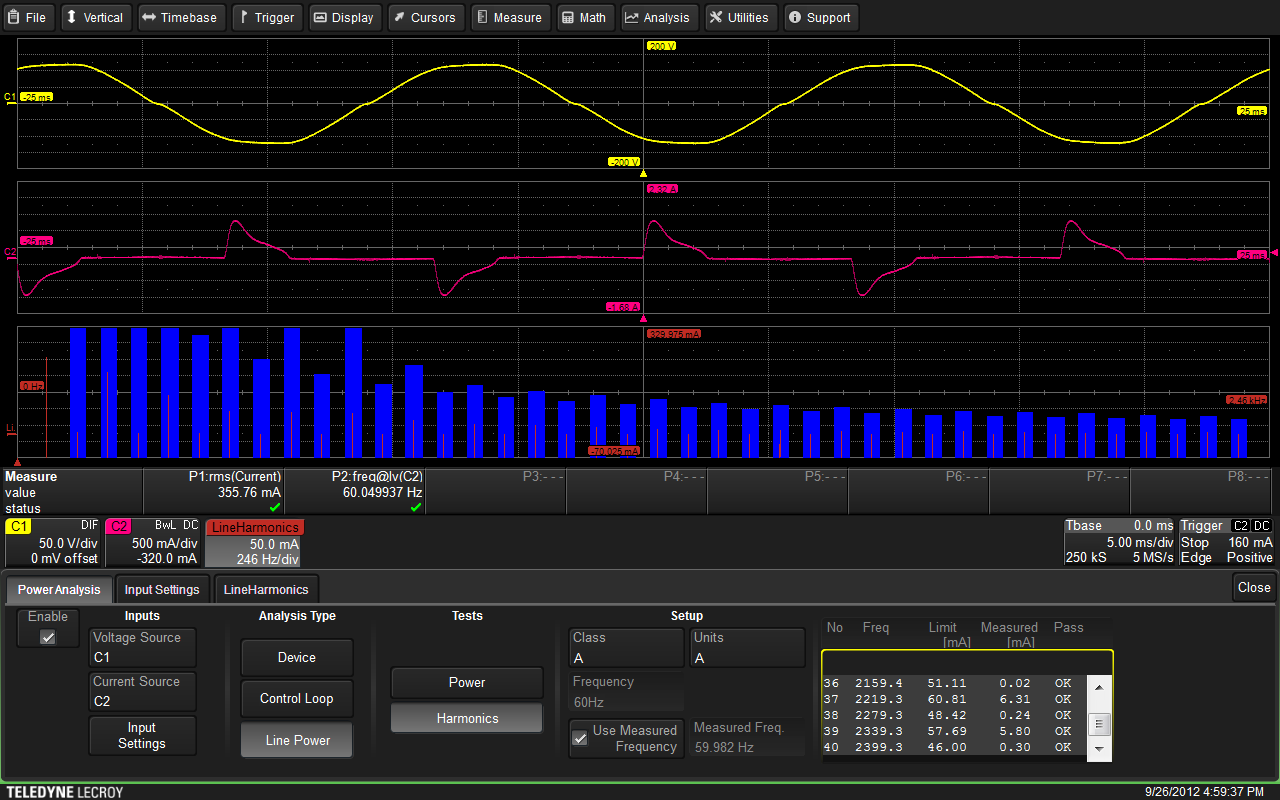
Line power analysis showing the harmonics of line current. The table in the lower right lists each of 40 harmonics including it’s frequency and level
The Power Analyzer option for the HDO4000 and HDO6000 high definition oscilloscopes simplifies how power measurements are made. Power device performance while the device is operating in circuit can be analyzed without requiring specially designed test fixtures. The long memory of the HDO enables capture times in the 100s of milliseconds at high sample rates for finding unusual events during measurements.