Teledyne LeCroy’s HDO4000 and HDO6000 oscilloscopes offer a large complement of powerful hardware triggers, but even the most advanced hardware triggers carry limitations in that they can find an event predetermined by the user. Thus, the HDO4000 and HDO6000 oscilloscopes are augmented with WaveScan Search and Find technology. WaveScan is an advanced search and analysis tool that provides the ability to quickly locate and characterize unusual events. WaveScan can detect anomalies within a single capture and can also operate in continuous scanning mode, constantly monitoring incoming waveforms. There are many search criteria to choose from, including non-monotonic edge detection, runt mode, and a large number of parametric measurement criteria, including rise time, fall time, frequency, pulse width, duty cycle, and many others.
The WaveScan feature can be accessed from the front panel or through the Analysis pull-down menu. Using Teledyne LeCroy’s WaveSource 100 evaluation source to input a signal with a slow rise time, the screen will look similar to Figure 1.
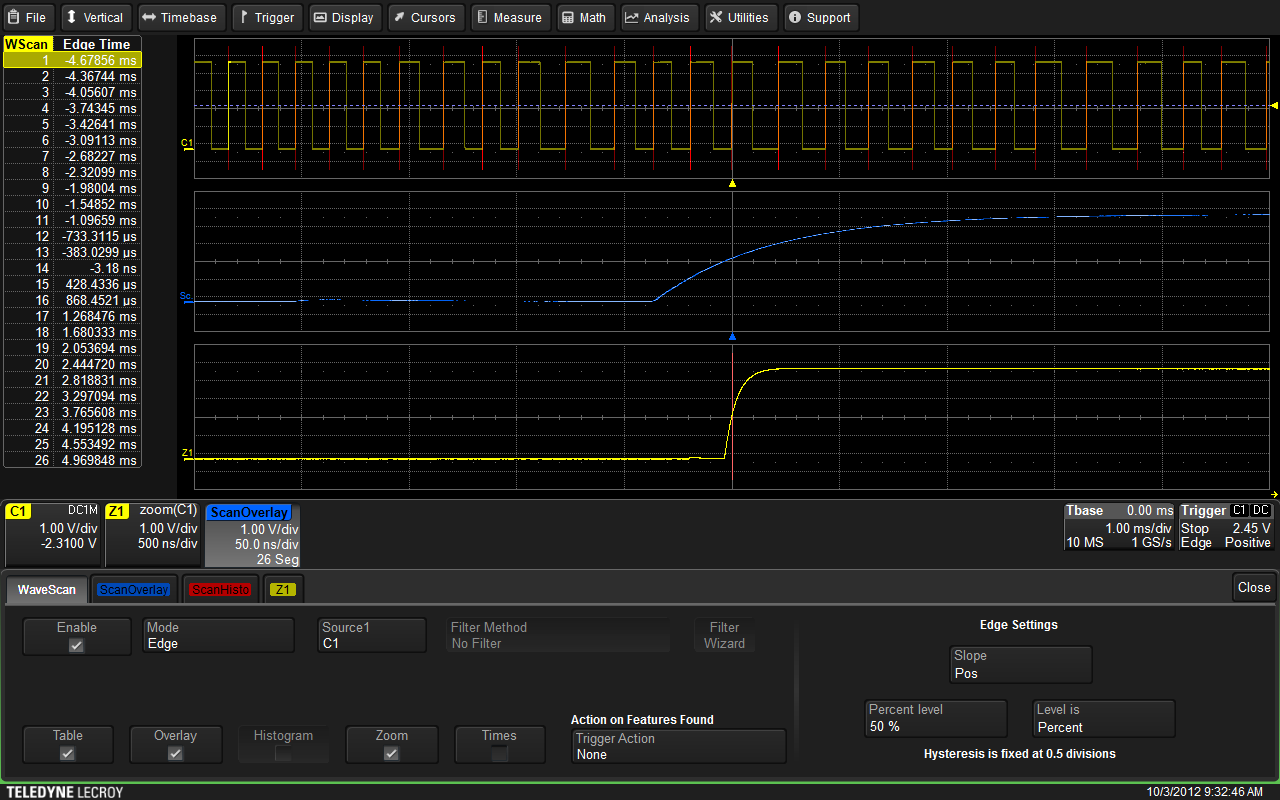
The initial setup screen for WaveScan is the starting point for deep signal exploration
In Figure 1, WaveScan is still in its default state, which is edge mode, and edge settings are for a positive slope where the edge threshold is 50% of the signal amplitude. Note that all such edges in the input signal are highlighted in red. The first edge in the signal trace is brighter, indicating highlighting, and that highlighted section appears in the WaveScan zoom view below.
When using WaveScan, note that the zoomed area of the signal trace may be manipulated using the HDO zoom controls. In addition, WaveScan’s powerful controls enable searching for a wide range of anomalies within the signal. Opening the Mode menu within the WaveScan dialog reveals numerous options, including searching for edges, runts, non-monotonic edges, serial or bus patterns, and measurements. Each mode can be further customized to specify the precise nature of the anomaly.
With the Table option enabled, WaveScan will display all occurrences of the condition being searched for. In the example of Figure 2, the WaveScan table shows the times at which each of the edges in the trace occurred relative to the cursor. Tapping any of the lines in the table changes the zoom view to the corresponding event in the signal trace. In this case, the zoom view is of the sixth edge shown in Channel 1.
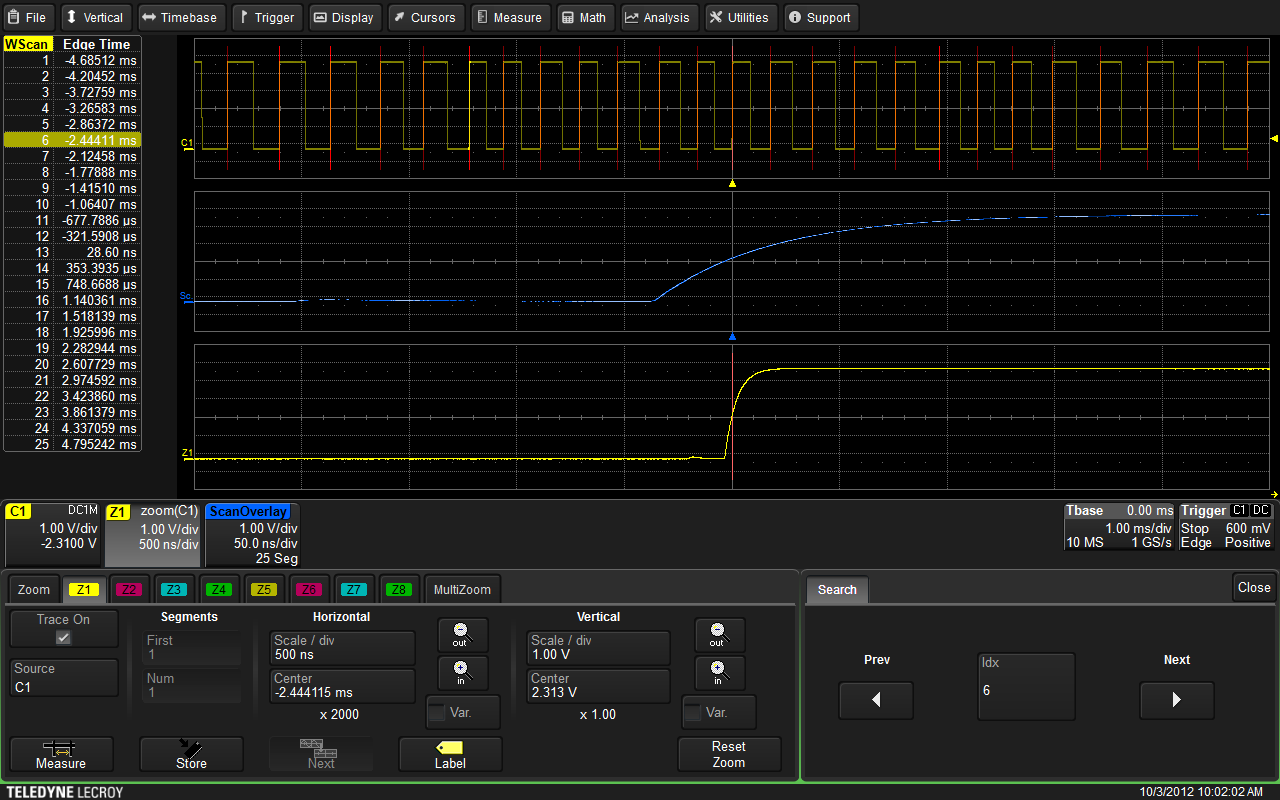
Tapping any line in the WaveScan table changes the zoom view to the corresponding event
To further refine searches for signal anomalies, WaveScan’s measurement mode provides a measurement filter. This allows for measurement criteria to include attributes such as less than, greater than, within or outside of a limit, plus or minus a delta, plus or minus a percentage, or the rarest events. Users may also invoke a filter wizard, which can establish limits based on statistical distributions of the data set (such as ±1 sigma). As shown in Figure 3, one may, for example, direct WaveScan to find the rarest events in the signal trace, and define what
event is being sought. In this example, WaveScan has been charged with finding the edges with the shortest and longest rise times. Clicking on that result in the table highlights the corresponding edge. WaveScan can also direct the HDO to take specific actions upon finding the sought-after event, including stopping acquisitions, saving waveform(s), printing the screen, or simply beeping, among others. Note also in Figure 3 that statistics have been turned on in the Measurement Setup menu, as have histicons and the start/stop times for the edges.
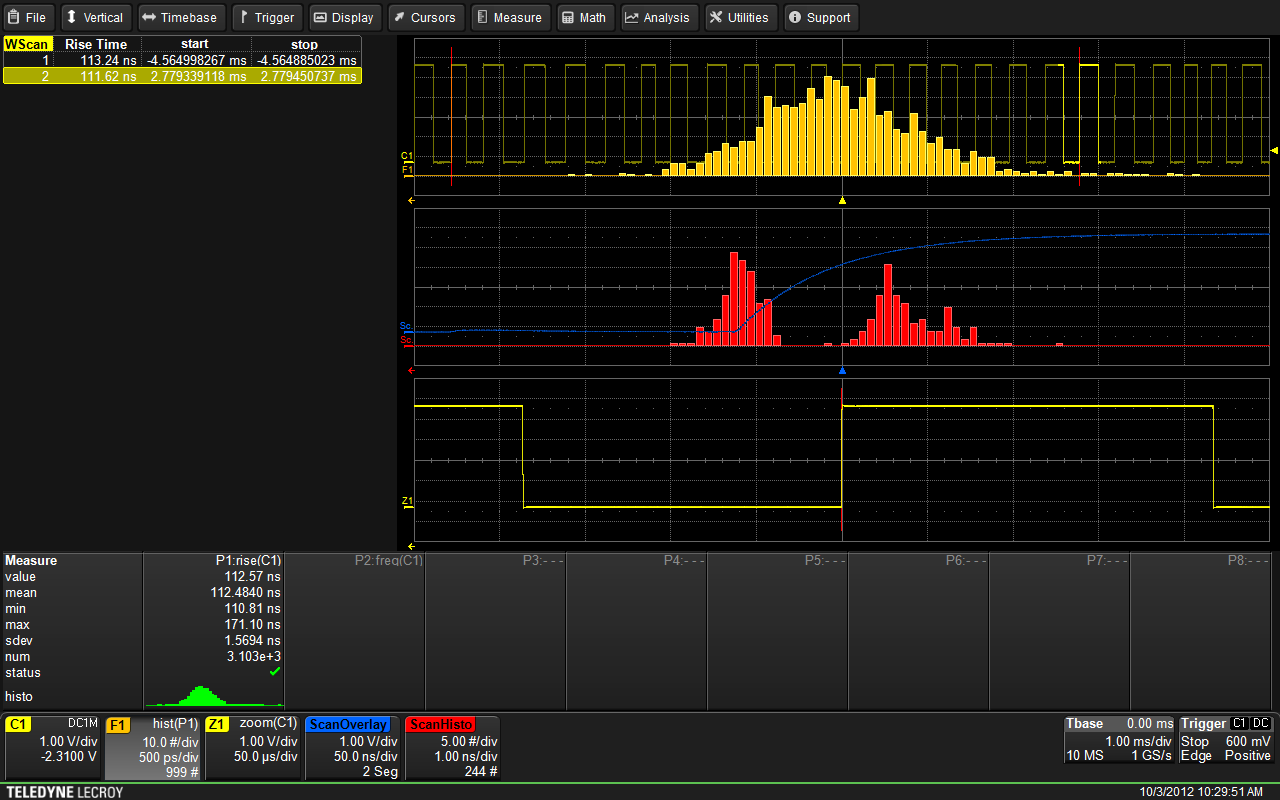
Shown is WaveScan in Measurement mode and filtering for the smallest and largest rise times in the signal trace
Another valuable tool available within WaveScan is statistical analysis in the form of histograms, which can help characterize random events. Histograms can be accessed from the WaveScan dialog box by checking the Histogram box. Users have complete manual control of the nature of the random events to be analyzed, or a Filter Wizard may be invoked to automate the process as shown in Figure 4. In this case, the Filter Wizard has been configured to Find Rare Events that fall outside a delta.
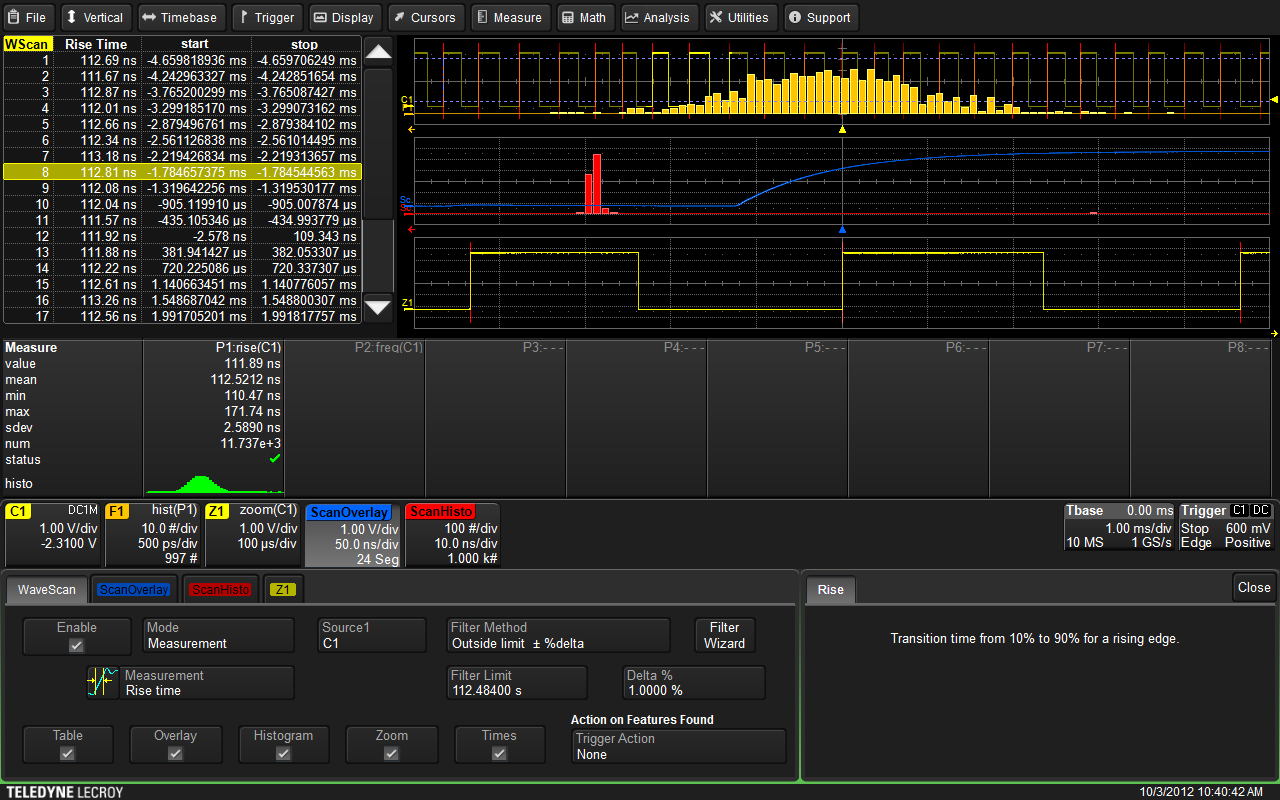
WaveScan’s Histogram function enables HDO6000 oscilloscopes to create a persistence display of only the results that meet the users’ predefined criteria. This is shown in the blue trace in the center grid
In the HDO6000, the scan overlay function may be activated from the WaveScan menu. Unlike a standard persistence display, WaveScan evaluates the data first, then includes only those pulses in the scan overlay persistent display which have met the user-defined criteria, as shown in Figure 4. Scan Histo is a special type of measurement histogram which includes only the results meeting the user defined criteria.
For example, in scanning for rise time anomalies on a system clock, the Scan Histo can be configured to record only those rise times with values greater than a specified limit. WaveScan builds on the Teledyne LeCroy legacy of fast data processing and will quickly scan millions of events, looking for unusual occurrences and display the results with unprecedented speed.
In continuous scanning mode, software trigger actions can be set to take place when an event is found. Some of the choices include stopping the acquisition, saving waveforms, saving the screen image, creating a LabNotebook entry, beeping to get user’s attention, generating an output pulse that can be used by other instruments, or automatically sending an email.
WaveScan capability is not limited to input channels. Scans can also be performed on memory traces, math functions, and chains of math or measurement operators, allowing second or third level analysis to be performed. For example, the first derivative of the waveform edge is computed, and WaveScan is scanning for non-monotonic edges. However, the input source is not channel one; it’s the first derivative math operator. Therefore, WaveScan is verifying the linearity of the rate of change.
WaveScan adds considerable functionality to the HDO4000 and HDO6000 beyond what is offered by any hardware trigger. While a hardware trigger only finds one event per acquisition, WaveScan identifies all events which meet the criteria. Also, the types of waveform activity that can be found by WaveScan are more in-depth than that offered by hardware triggers. This allows users to accumulate a data set of unusual events that are separated by hours, minutes, or even days, enabling comprehensive debugging.