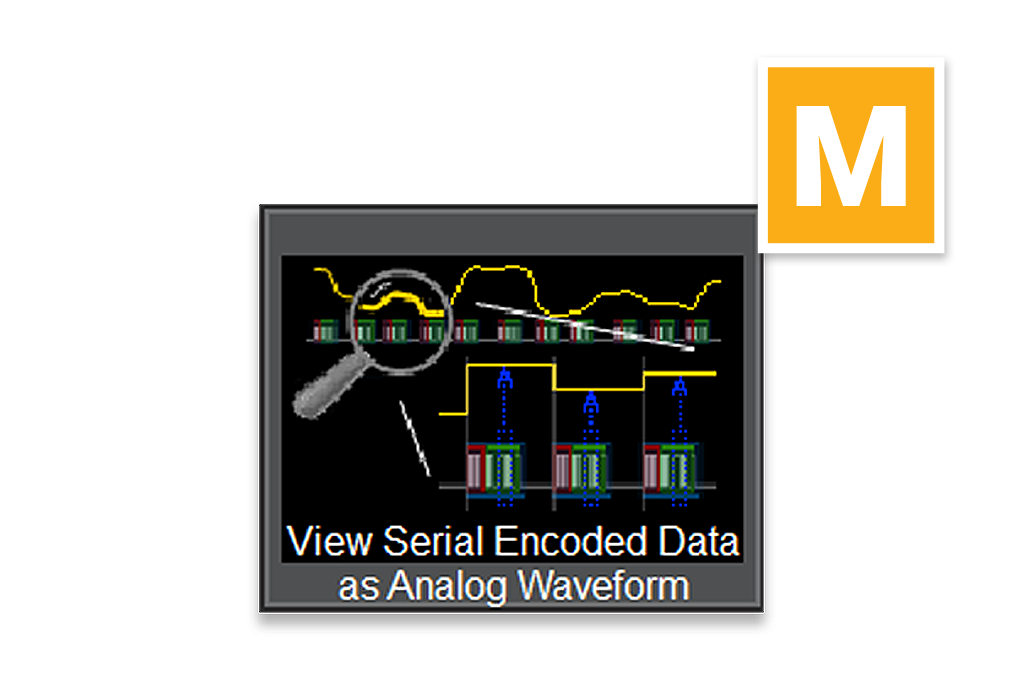
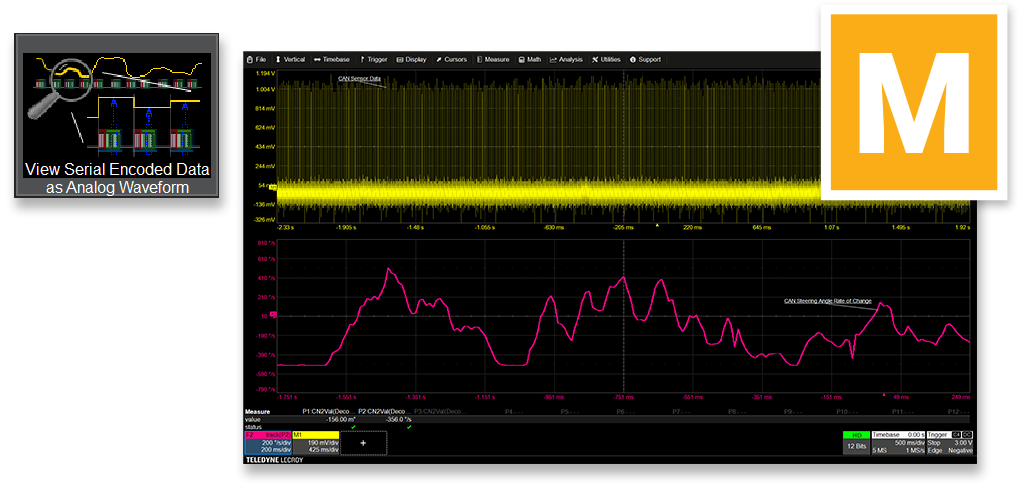
Vehicle steering wheel angle and rate of change data
embedded in Controlled Area Network (CAN) is extracted, rescaled to
correct units of measure, and plotted as if it were an analog waveform.
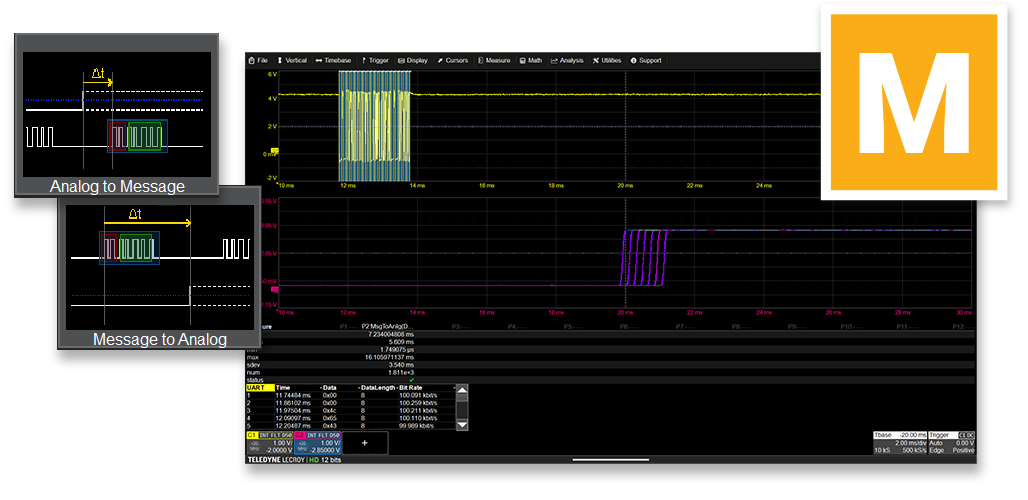
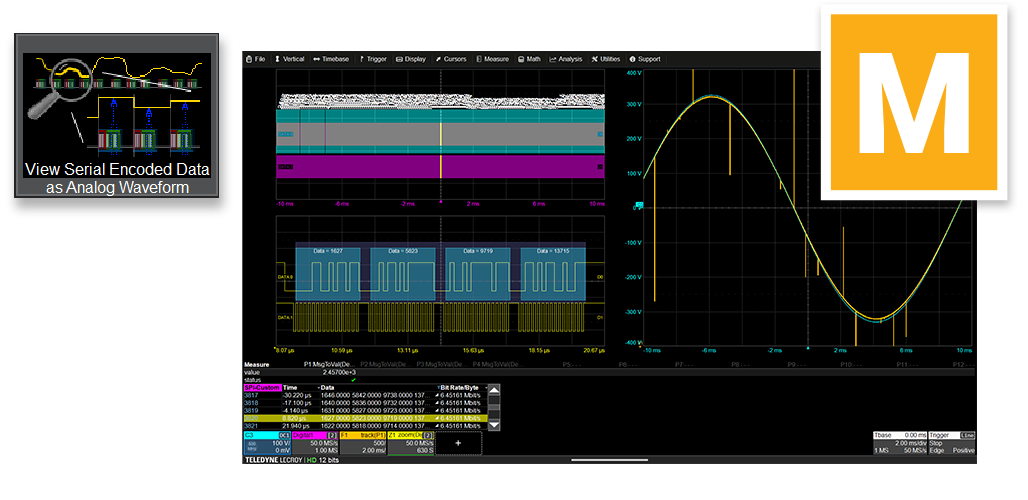
Serial Peripheral Interface (SPI) clock (DATA1 digital line,
magenta signal in top left) and data signal (DATA0 digital line, blue
signal upper left) acquired for 20 ms (thousands of messages).
Individual packets are zoomed (yellow signals in lower left).
- SPI digital data is presented in the protocol table.
- F1 (orange signal, right side) is the plot of the extracted SPI
digital data.
- C3 (blue trace, right side, underneath the F1 orange signal) is the
analog reference waveform that was encoded as digital data.
- The spikes on the F1 (orange signal) are errors in ADC.
-
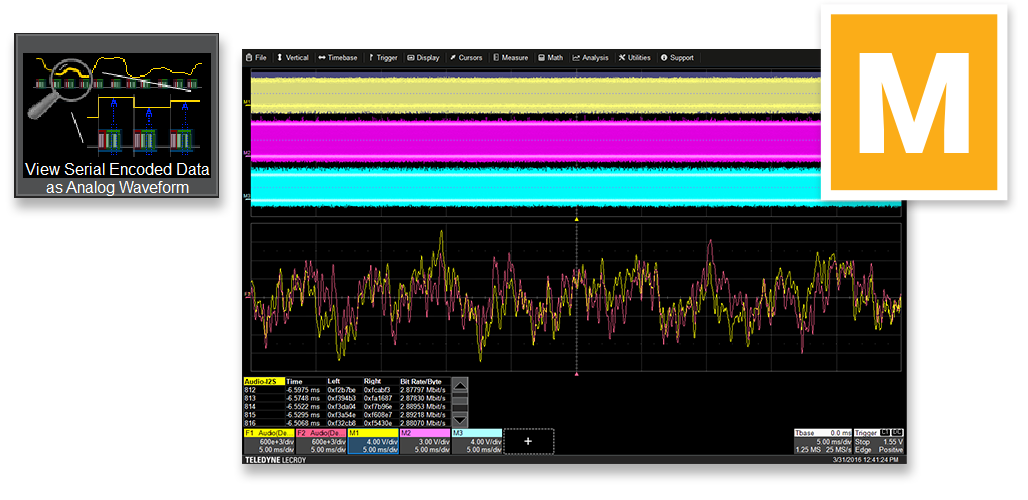
I2S Serial Audio clock (M1, yellow signal at top) and
left/right data channels (M2, magenta signal; M3 blue signal at top) are
acquired for 50 ms (thousands of messages).
- Left and Right audio channel serial data is plotted as an analog
waveform (F1, yellow, left channel; F2, red, right channel; signals
at bottom)
- Viewing the digital audio data as an analog waveform can help to
quickly assess whether there is audio clipping or other anomalous
behaviors.
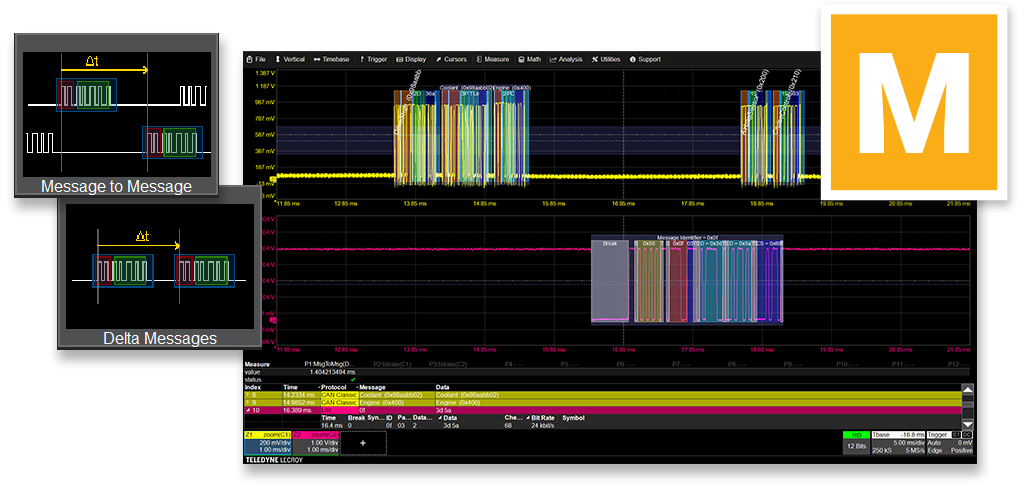
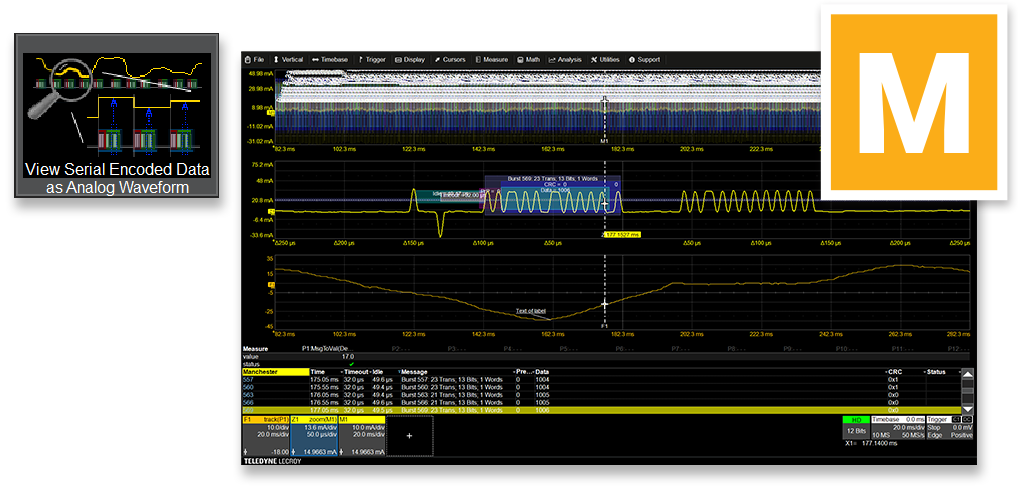
PSI5 data signal (M1, annotated signal at top) is acquired
for 200 ms (thousands of messages)
- Middle signal (Z1, yellow) is a zoom of the full acquisition to show
just one PSI5 message.
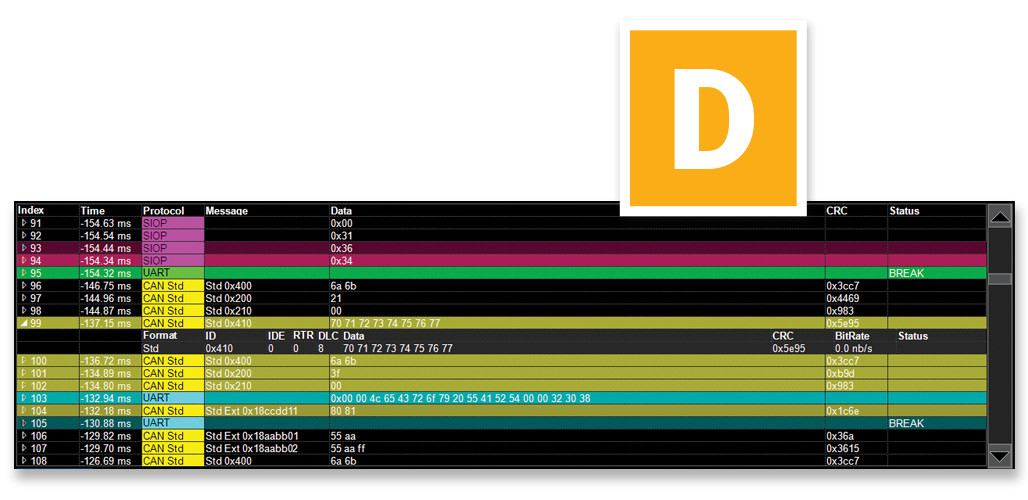
- All protocol data is shown in the table at the bottom of the image.
- Bottom signal (F1, orange) is a plot of the digital data embedded in
the PSI5 messages, time-correlated to the original acquisition.
-
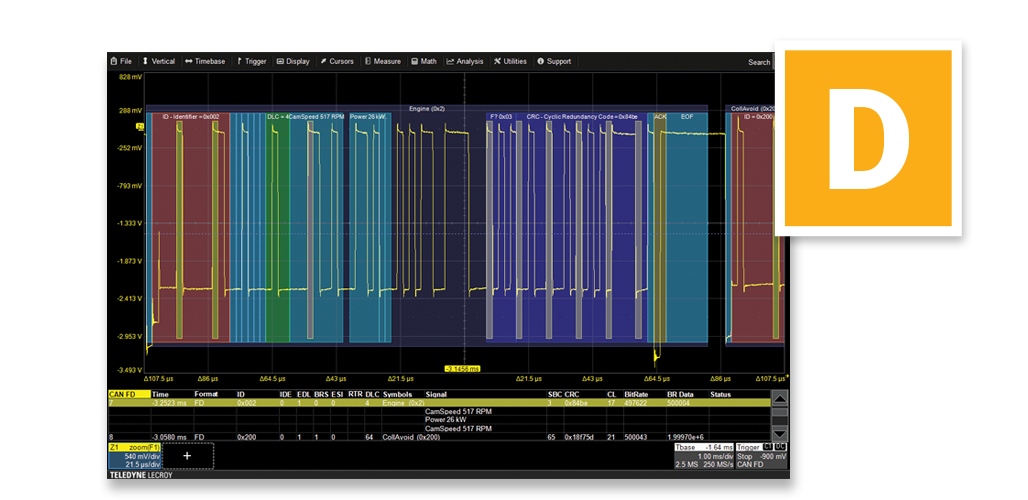
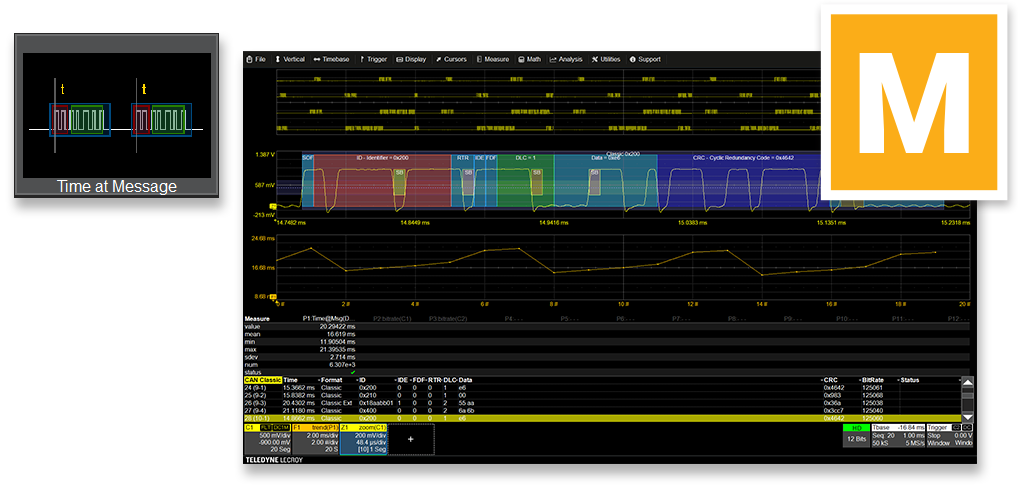
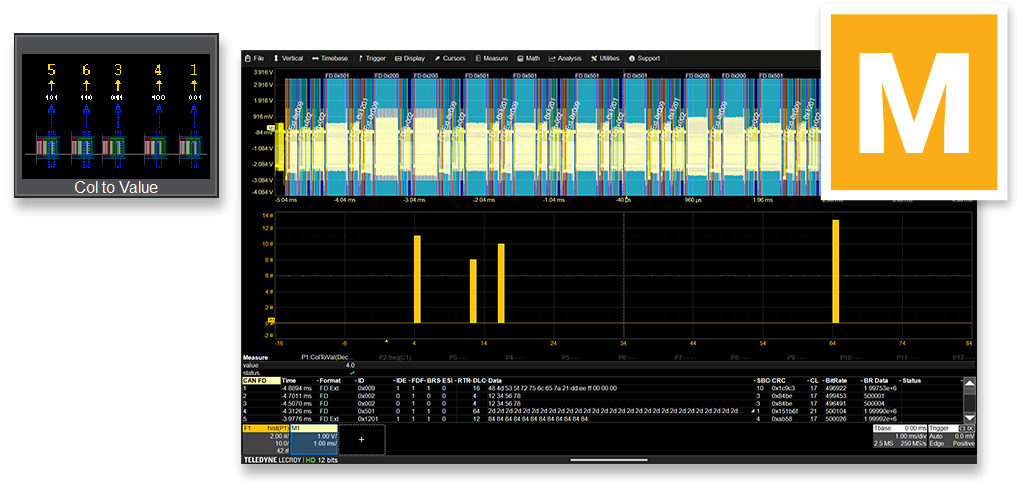
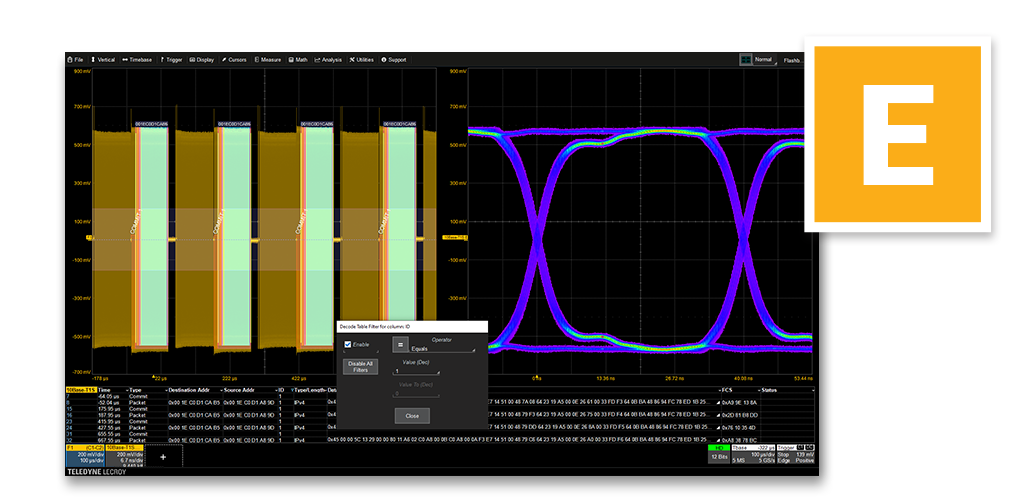
CAN data (M1, yellow signal at top) is acquired for 10 ms.
This example demonstrates using data in the protocol table to evaluate
some aspect of system performance.
- Data Length Code (DLC – the number of data bytes in each CAN
message) is read from the table using the Column-to-Value
measurement capability.
- Measurement parameter P1 aggregates the table data as a measurement
value with min, max, and statistics (42 measured values total).
- All protocol data is shown in the table at the bottom of the image.
- Bottom signal (F1, orange) is histogram showing how many packets
contain 4, 12, 16, or 64 bytes, enabling quick analysis of data
distribution and network behavior.
-